San Jose Crash Statistics: Press Kit and Reusable Charts
Use these findings to investigate a local question, illustrate a story or support a community discussion. Keep the period, source and limits with every graphic.
San José's highest crash counts and highest serious-crash counts point to different intersections
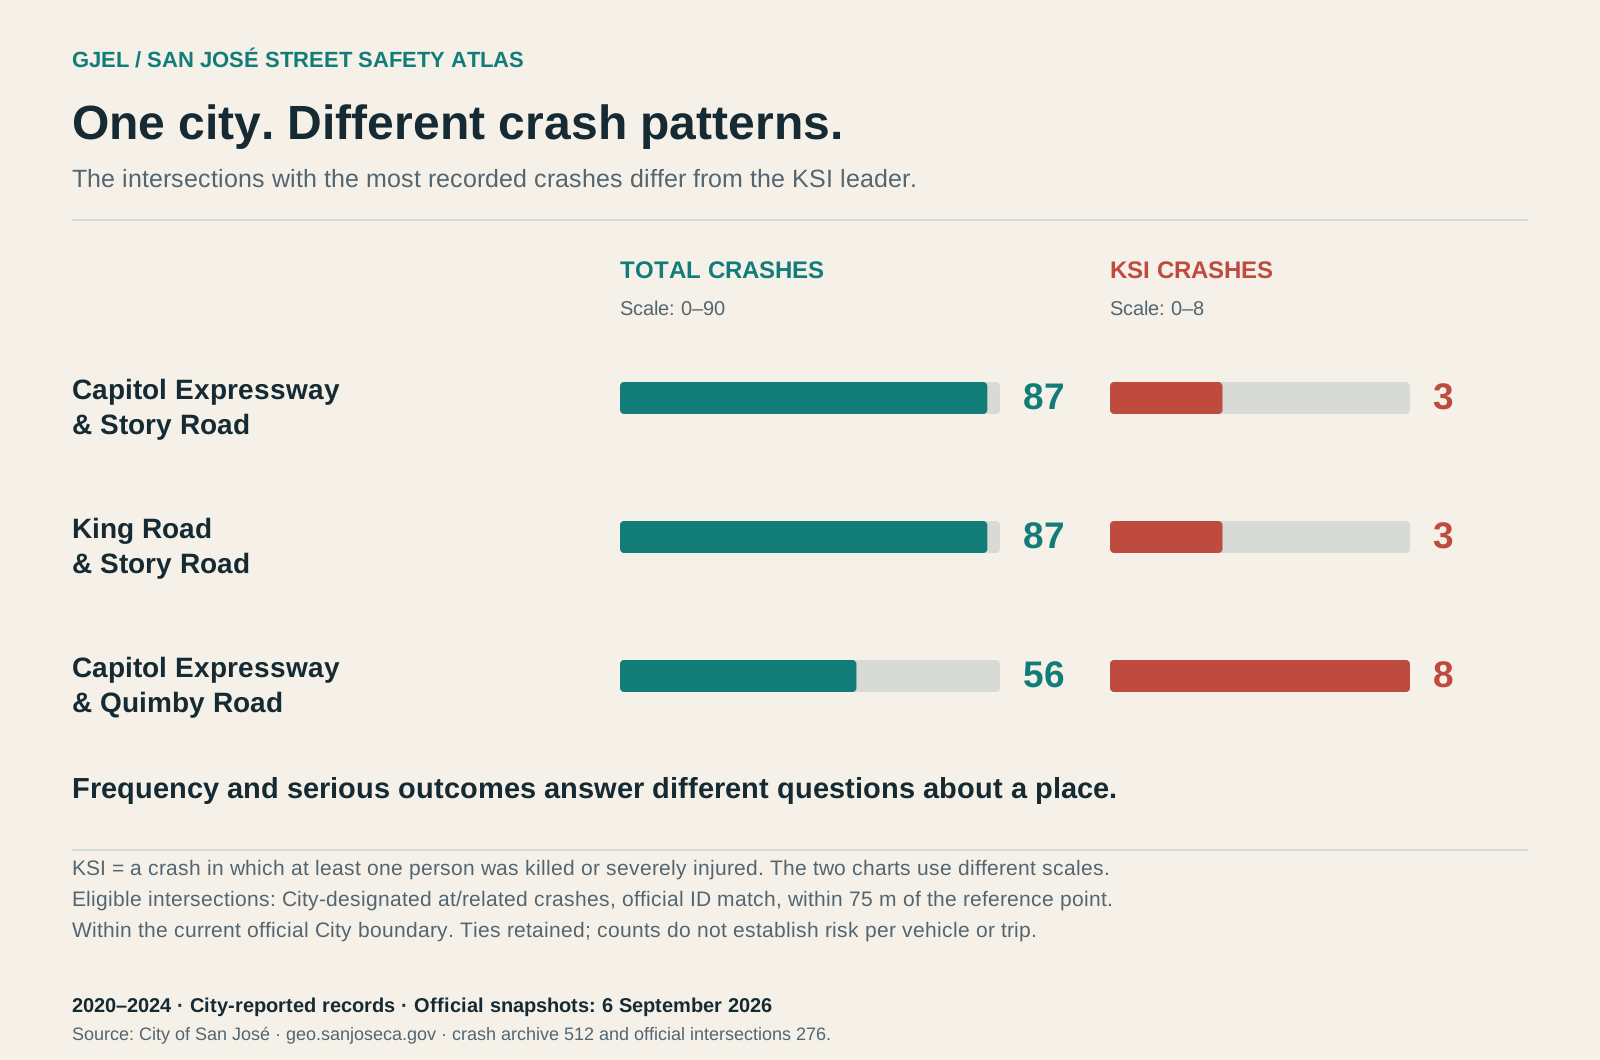
Capitol Expressway & Story Road and King Road & Story Road tie for the highest total in the eligible City intersection table, with 87 crashes each during 2020–2024. Frequency shows the scale of reported collisions. It does not account for how many people or vehicles pass through a place. Capitol Expressway & Quimby Road leads the eligible intersection table with 8 KSI crashes among 56 total crashes during 2020–2024. Those crashes recorded 10 severely injured people and 0 fatalities. KSI counts crashes with at least one person killed or severely injured; it is a different measure from the number of injured people.
Keep the shared frequency lead and the eligible-intersection definition. Do not headline this as the highest risk per trip.
A walking and cycling view reveals another serious-crash pattern
Capitol Avenue & McKee Road leads the eligible intersection table for pedestrian-or-bicycle-involved KSI crashes, with 6 during 2020–2024. Across the retained City sample, pedestrians were recorded in 5.63% of crashes and 28.68% of KSI crashes. Bicycle involvement was recorded in 5.23% and 12.91%, respectively. These recorded-positive shares include unknown-mode records in their denominators. They describe involvement, not which person was injured or the risk per trip.
Do not relabel mode-involved crashes as pedestrian or cyclist injuries. Publish unknown coverage alongside the shares.
How recorded serious crashes overlap San José's Priority Safety Corridors
631 of the 1224 retained City KSI crashes (51.55%) occurred within 30 meters of official Priority Safety Corridor geometry. Monterey Road has the highest nearby KSI count among those official corridors in this analysis, with 55. Nearby corridor counts may overlap.
This is a contemporary analytical proximity comparison, not an assessment of whether a project caused a change or a reproduction of the City's corridor-selection method.
Each San Jose location report has a printable page, graphic and matching CSV. The explorer can export selected crash records and a map graphic with its filters.
Editorial independence and review
Published by GJEL Accident Attorneys. This analysis is independent of the City of San José, CHP, Caltrans and other source agencies; their publication of source data does not imply endorsement.
No independent transportation or GIS reviewer has been appointed or attested to review in this release. A named accountable author and monitored research contact are still being assigned before public outreach.
Describe “most reported crashes” or “most KSI crashes” precisely. Rankings do not establish legal fault, road defects, a project’s causal effect, or risk per trip.