A key challenge in planning, funding, and implementing bicycle and pedestrian projects is the lack of good data to guide policymaking. As Janie Nham notes on the NRDC Switchboard, bicycle and pedestrian data collection is generally limited to the American Community Survey (ACS) and the National Household Travel Survey (NHTS). Each of these surveys has significant limitations: the ACS only counts trips to work via a single mode (as opposed to trips to the grocery store or trips via multiple modes); the NHTS counts all trips but is only administered once every decade and has a dismal 20 percent response rate. Neither survey provides a good sense of origins, destinations, and routes traveled – and data from local governments is often not much better.
The Strava App fills an interesting niche as an aggregator of walking, running, and bicycling data: it allows users to track their routes and compiles this data into pretty maps which show the most popular walking/running and bicycling routes in any given area. The results tell an interesting story that’s gotten some press.
However, in assessing Strava’s data it is necessary to resist the temptation to make conclusions for policymaking. Strava has a few major shortcomings:
- Data is heavily skewed toward recreational trips
- Users of the app are not representative of the general population
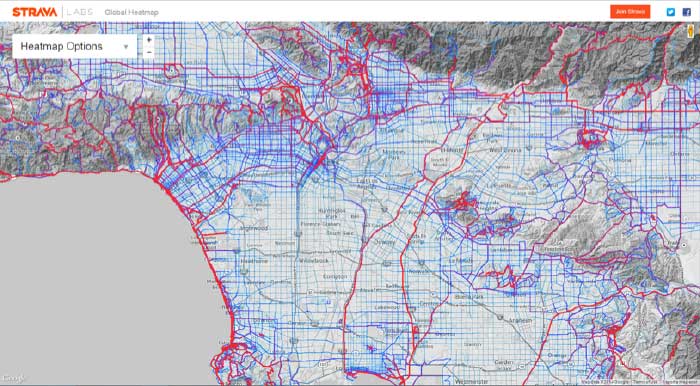
Consider the Strava bike heat maps for the Bay Area and Los Angeles (red = heaviest use):
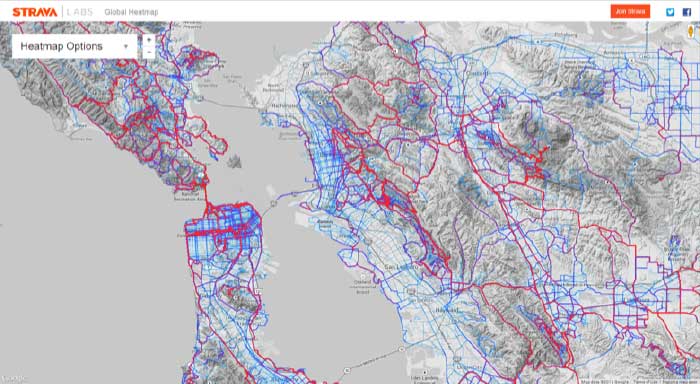
Unsurprisingly, bike paths and rural hilly roads are the most heavily used corridors in the Strava app. This data is a clear reflection of its user base, which is skewed toward recreational bicyclists. There are certainly a number of users that may track all of their trips by bike with the app, but they appear to be in the minority. For example, it’s likely that Telegraph Ave in Oakland has more bicyclists on a daily basis than Skyline Blvd, but fewer people track their trips on Telegraph.
Another key takeaway from the data is the lack of user base in predominantly minority areas. Looking at the Strava data, one would assume that nobody bikes in minority or low income areas like Richmond, East Oakland, or South and East LA – perpetuating the narrative that bicycling is limited to young white hipsters. Yet, the opposite is true: as Sahra Sulaiman chronicles time and time again for StreetsblogLA, many people in South and East LA rely on bicycling to get around, and a well-developed bicycle culture exists (despite often dangerous street designs in these areas). It just so happens most people do not use Strava to track their trips.
Strava is a great tool and produces very cool data. Let’s make sure we’re interpreting that data correctly.

Andy Gillin received his Bachelor’s Degree from the University of California at Berkeley and his law degree from the University of Chicago. He is the managing partner of GJEL Accident Attorneys and has written and lectured in the field of plaintiffs’ personal injury law for numerous organizations. Since 1972 he has been helping seriously injured victims throughout northern California fight & win their personal injury cases. Andy is one of the top awarded & recognized wrongful death lawyers in northern California.