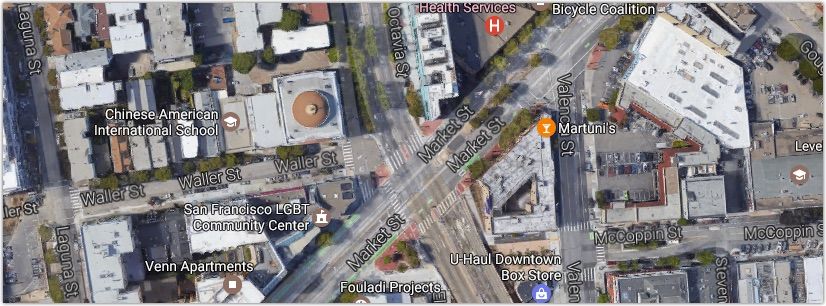
The intersection at Market and Octavia street in San Francisco tops our list of the Bay Area’s most dangerous intersections for cyclists.
Several cities in the San Francisco Bay Area have landed on Bicycling.com’s 100 Best Bike Cities of 2016, including San Francisco at #2, Oakland at #21, and San Jose at #26.
At GJEL Accident Attorneys we’ve represented injured cyclists throughout our 45+ year history. In fact, many of the attorneys and legal professional on our staff are avid cyclists. Naturally, we take these cycling accident cases incredibly personally.
What areas are the most dangerous areas for cyclists in the Bay Area?
In an effort to help our fellow Bay Area cyclists identify the areas in their communities that are especially dangerous, we’ve parsed and analyzed five years (2011-2015) and tens of thousands of rows of crash data from the Statewide Integrated Traffic Records System (SWITRS). We examined every bicycle vs. car collision in all 100 Bay Area cities, taking into account total collisions, injuries, and fatalities, to determine the most dangerous intersections.
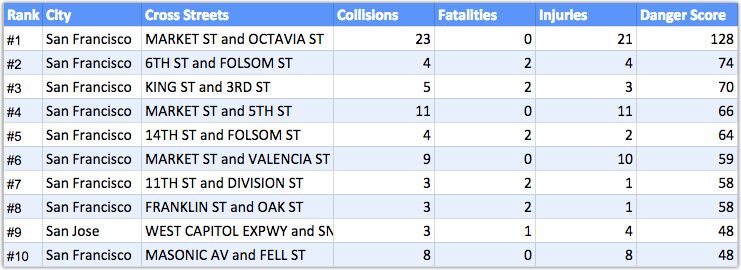
Here are the most dangerous intersections for cyclists in the Bay Area:
Interactive Map of The Most Dangerous Intersections
Use the interactive map below to zoom in on the areas where you frequently bike to see details about the most dangerous intersections. The bigger the circle, the more dangerous the intersection. You can also hover over each circle to see the cross streets and crash statistics.
Key Findings
- Between 2011 and 2014 there were 708 crashes, 676 injuries and 45 fatalities at the 225 intersections in our study.
- The intersection at MARKET ST and OCTAVIA ST in San Francisco is the most dangerous intersection for cyclists in the Bay Area. There were 23 cyclists collisions resulting in 21 injuries at this intersection alone from 2011-2015.
- 89 of the 225 intersections from our study are in San Francisco, including the top 8 most dangerous intersections.
- There were 12 fatalities at San Jose intersections, making it the most deadly city from our study. San Francisco comes in a close second with 11 fatalities.
What Was The Methodology Of The Study?
We examined five years (2011-2015) worth of cyclist vs. vehicle collision records provided by the Statewide Integrated Traffic Records System (SWITRS) for all 100 cities that make up the San Francisco Bay Area. We narrowed the data down to only those collisions that occurred at an intersection.
Next, we collated the collision records in order to determine which Bay Area intersections produced the most collisions, injuries, and fatalities. We then assigned a ‘Danger Score’ to each intersection based on the following formula:
Formula: Total Crashes + Fatalities (x25) + Injuries (x5) = Danger Score
The higher the Danger Score, the more dangerous the intersection.

Andy Gillin received his Bachelor’s Degree from the University of California at Berkeley and his law degree from the University of Chicago. He is the managing partner of GJEL Accident Attorneys and has written and lectured in the field of plaintiffs’ personal injury law for numerous organizations. Since 1972 he has been helping seriously injured victims throughout northern California fight & win their personal injury cases. Andy is one of the top awarded & recognized wrongful death lawyers in northern California.